Diffusion Simulation with Composition Profile Input
In this tutorial, the Fe-Ni-Cr alloy is taken as an example to demonstrate a diffusion simulation with a composition profile input. The format of input file is discussed in Section Set Initial Composition Profile. The database file mentioned in this section, “FeCrNi.tdb”, can be found in the installation folder of Pandat™. In general, user should follow the following steps to carry out a diffusion simulation:
Set up Initial Condition for Diffusion Simulation
Figure 1 demonstrates the conditions of this simulation. The initial composition profile from the input file is displayed in this figure. The length of the profile is 200 μm and is discretized to 100 grids.
To set the above conditions in PanDiffusion, click through on the tool bar, or from the menu “PanDiffusion→ Diffusion Simulation” a popup window as shown in Figure 2
Figure 2: Dialog window for user to input diffusion simulation conditions and composition of Region_1
Simulation Results
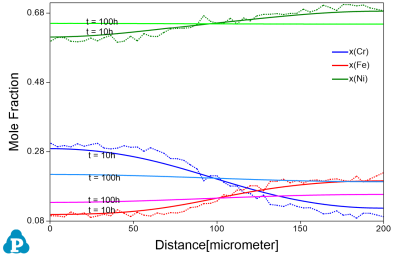
Click OK button in Figure 2 to start the simulation after the initial condition is set properly. The simulation result is displayed in Figure 3. Please refer to Section Graph of this user manual to add text, legend, and change the appearance of the figure.
As is seen in this figure, the initial serrated composition profiles were smoothed out after 10 hours of annealing at 1200 °C, and the material is homogenized after 100 hours of annealing.


